Overview
The Paths to Conversion report in illumin is a Canvas-level diagnostic tool that visualizes multi-touch user journeys before conversion. The report helps marketers understand which campaign, tactic, or ad type sequences drive conversions across the illumin ecosystem.
The illumin report uses an intuitive visual sequence to show real‑world user behavior. It illustrates how users move and engage between multiple campaigns and tactics, and how they interact with your ads before conversion and site engagement.
The report allows marketers to:
- De‑silo performance: See how upper‑funnel awareness (e.g. CTV and video campaigns) interacts with mid‑funnel consideration (e.g. display campaigns) to drive final action.
- Identify winning sequences: Quickly pinpoint the specific combinations that yield the highest conversion rates.
- Optimize path length: Understand the frequency and number of touchpoints required to move a user through the funnel.
By bridging the gap between awareness and conversion, this report helps marketers move beyond last-click thinking and find the value of different touchpoints in the user journey.
Prerequisites
The Paths to Conversion report automatically runs in the background for eligible live campaigns on the Canvas (new experience). No manual setup is required. Real-time data populates the report once all of the following conditions are satisfied:
- At least one campaign on the Canvas (new experience) has two or more tactics.
- At least one conversion action is created and assigned.
- At least one conversion has occurred.
- Campaign, tactic, or ad-type exposure is trackable for the user.
If the Canvas contains only one campaign with one tactic and a conversion, no data appears.
Open the report
- Open a campaign on the Canvas (new experience).
- Go to the action bar at the bottom of the Canvas.
- Click the lightbulb icon in the action bar toolbar to open the Paths to Conversion report..
Enable the filters
On the next page, enable filters and set the time period.
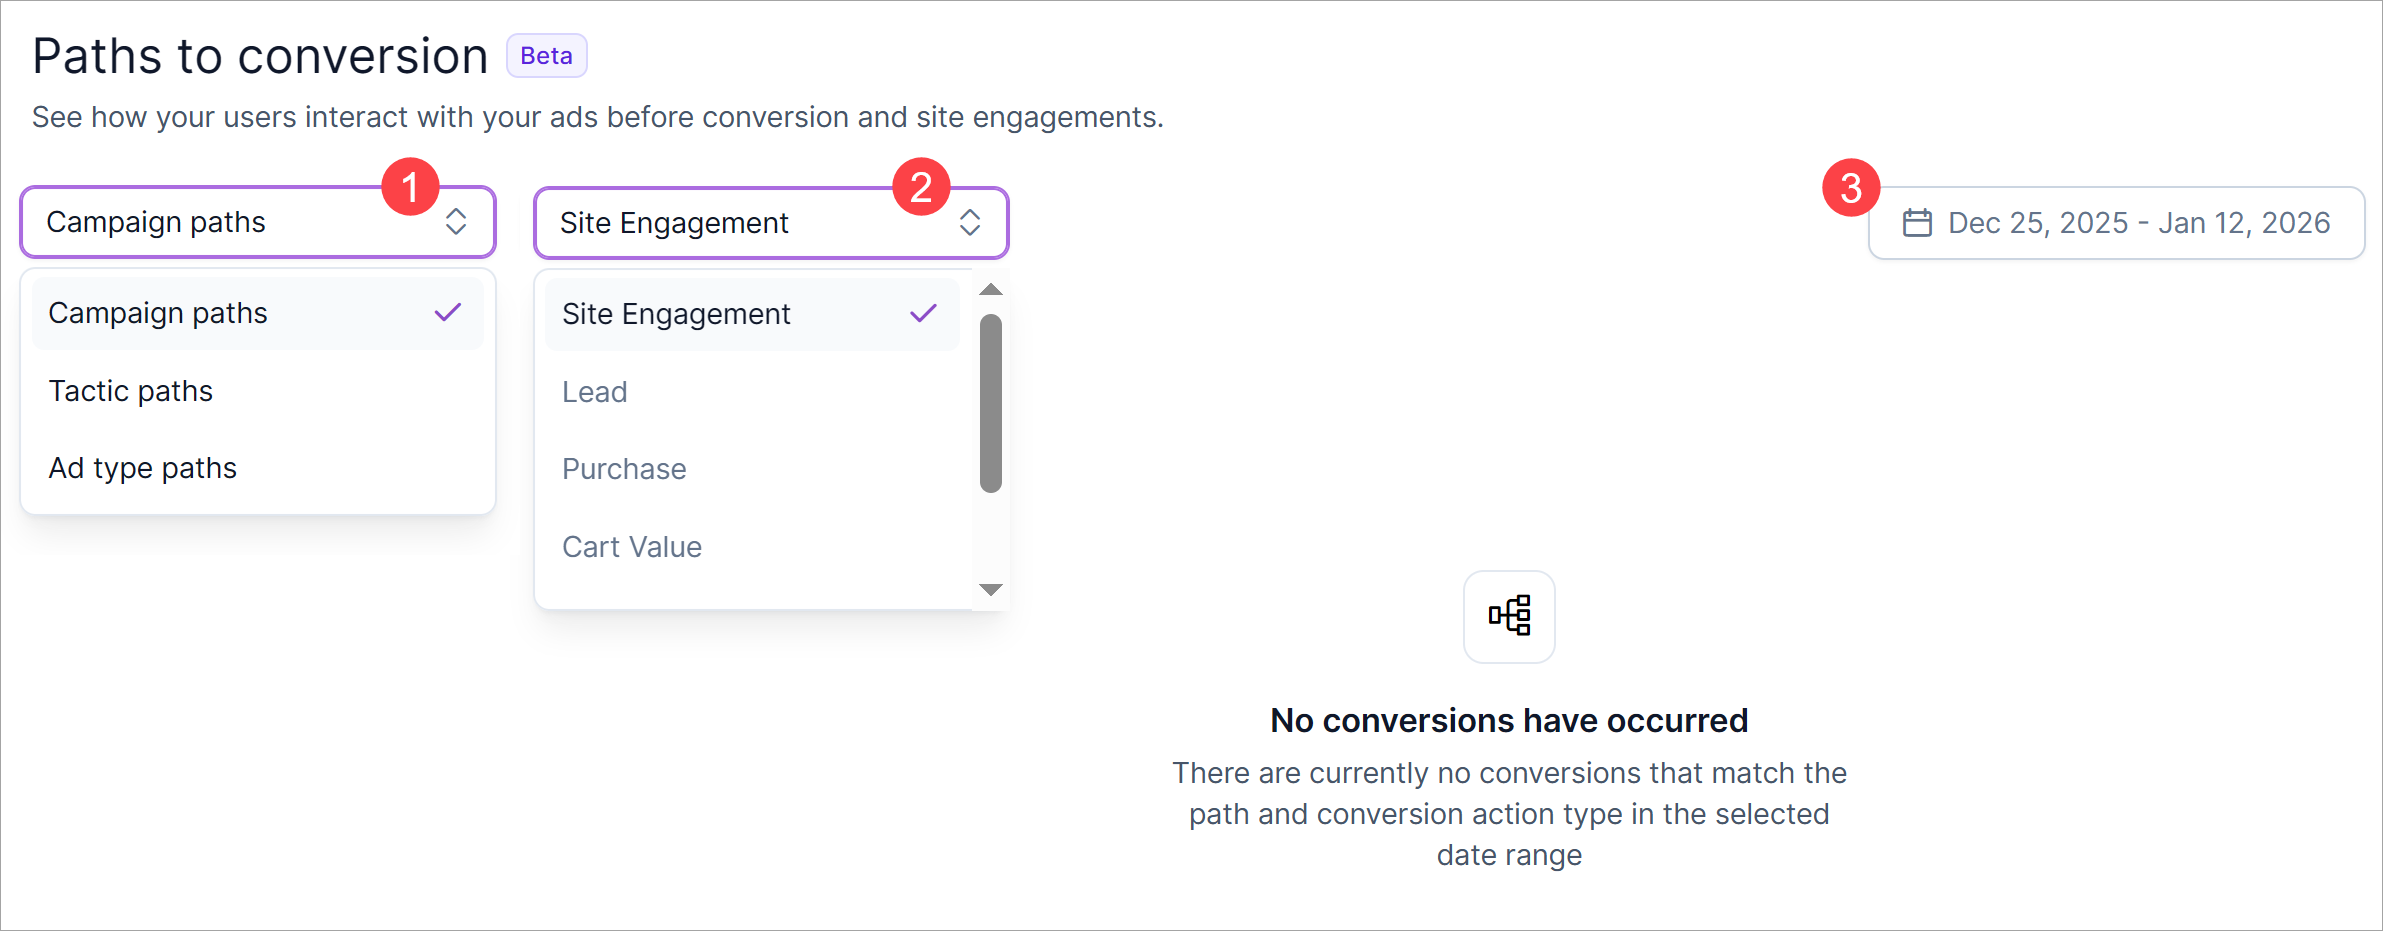
Step 1. Go to the path field and review the options.
The default setting is Campaign paths. Choose this option to learn how all the campaigns on the Canvas (connected or not connected) are working together to drive the selected conversion.
The other options are Tactic paths, which displays the most effective chain of tactic-level touchpoints, and Ad type paths. By default, the platform disables the Ad type paths menu option unless a) the campaign has multiple ad types (e.g. audio, CTV, etc.) and b) users are converting on the ad types at different rates.
Step 2. Click the next field and select an eligible conversion type.
The default setting is Site Engagement. The other conversion options are Lead, Purchase, Cart Value, Contact, and Sign Up. Ineligible options (e.g. they aren't active or part of the campaign or tactic) cannot be selected.
Step 3. Click the date range and select an end date for the reporting period.
Note the start date is fixed and cannot be changed. The latest available end date is 24 hours ago.
Review the table structure
The report table displays the top three pathways based on number of conversions. Each row shows data for a set of metrics and a visual display of the touchpoints in the pathway.
Note, these are not the only conversion pathways. However, these three represent the sequences driving the highest number of conversions. illumin highlights the top three for clarity, even though additional pathways exist in the campaign.
Metrics explained
- Converted users: number of unique users who converted after completing the path sequence.
- Time to convert: average number of days it took users to move through the sequence and convert.
- Average frequency: average number of impressions the campaign served to users who completed the path.
- Cart revenue: aggregated cart value attributed to the sequence. This metric reports data if revenue tracking is enabled.
- Conversions: total number of conversions attributed to the sequence.
Note: the number of converted users might not always equal the number of conversions. This can happen if a single user converts multiple times during the campaign. Another reason is the acceptance ratio set in the conversion action. If the ratio is less than 100%, not all conversions are credited. For example, if 500 users convert and the acceptance ratio is set to 50%, the platform only attributes 250 conversions.
Pathways explained
The report identifies the three most impactful campaign journeys measured by volume for the selected element (e.g. campaigns) and conversion type (e.g. site engagement). illumin builds these pathways - Primary, Secondary, and Tertiary - by stitching together impression‑level data across the Canvas. The result is a visual display of how audiences move through sequences of campaign, tactic, or ad format touches, and frequencies over time.
Each pathway shows the number of touchpoints, average time to convert, and the frequency of impressions.
Insights and strategic value
Here's an example of how marketers can use report data to construct insights and strategic implications that can shape campaign optimization.
Primary pathway
- Performance: 711 leads generated, average conversion time of 8 days, about 2.7 impressions per user.
- Insight: This pathway demonstrates high efficiency, converting quickly with minimal frequency.
- Strategic implication: Scale investment in this campaign structure to maximize reach and replicate its short, effective conversion cycle.
Secondary pathway
- Performance: Conversions required about 20 days, 47 impressions, and six touches.
- Insight: This pathway highlights the role of sustained exposure and nurturing for harder‑to‑convert audiences. Another possible explanation is that the user connected campaigns, which can reinforce the sequence and cause the path to continue occurring.
- Strategic implication: Optimize frequency management and creative rotation to reduce impression waste while maintaining persistence.
Tertiary pathway
- Performance: Similar number of touches as the Secondary pathway, but with fewer impressions and shorter conversion time.
- Insight: Efficiency improves when the quality and sequencing of touches are optimized.
- Strategic implication: Refine sequencing and creative mix to replicate this more balanced conversion pattern across campaigns.
Strategic takeaways
- Efficiency vs. Persistence: The Primary pathway is the efficiency engine, while Secondary and Tertiary pathways show the importance of nurturing strategies for longer journeys.
- Frequency Optimization: Excessive impressions (47+) risk diminishing returns. Frequency caps and creative refreshes could improve efficiency.
- Sequencing matters: The order and relevance of campaign touches drive conversion speed and reduce waste.
- Budget allocation: Prioritize spend on efficient pathways while maintaining measured investment in longer journeys to capture incremental conversions.
Troubleshooting
- If no data appears in the report table, confirm that at least one campaign on the Canvas (new experience) contains two or more tactics and at least one recorded conversion.
- If the Ad type paths option in the Path dropdown field is disabled, confirm that the campaign includes multiple ad types and that users convert on those ad types at different rates.
- If a conversion type cannot be selected in the Conversion type dropdown field, confirm that the conversion action is active and assigned to the campaign or tactic.
FAQs
What does the Paths to Conversion report show?
The Paths to Conversion report shows the actual sequence of campaign, tactic, or ad-type exposures that lead users to convert. It reconstructs real exposure journeys across the Canvas to explain how impressions work together, beyond last-click attribution, to drive conversions and revenue.
Why does the Paths to Conversion report show no data?
The report shows no data when eligibility conditions are not met. The Canvas must include at least one campaign with two tactics, an active conversion action, and at least one recorded conversion. Exposure tracking must also exist at the campaign, tactic, or ad-type level.
How is Paths to Conversion different from assist or attribution reports?
Paths to Conversion differs because it reconstructs real user exposure sequences instead of assigning fractional credit by model rules. It visualizes how campaigns interact over time, which helps marketers understand collective impact rather than isolated channel or tactic performance.
How far back does the data go?
The Paths to Conversion report can be filtered by date range. The earliest available start date depends on when eligible campaigns began running, and the latest available end date is always 24 hours prior to the current day (to allow for data processing).
How long is the data available for?
Data remains available for the lifetime of the campaign within the enhanced Canvas. As long as the campaign and conversion actions are active, you can continue to access historical paths and filter by different time periods.
What constitutes a first touchpoint?
A first touchpoint is the initial campaign, tactic, or ad type exposure recorded for a user within the selected reporting period. It marks the beginning of the conversion journey that illumin stitches together in the pathway view.
Why are conversions less than converted users?
There are two possible reasons. A single user may convert multiple times, so the counts don’t always align. If the acceptance ratio for a conversion action is set below 100%, not all conversions are credited. For example, if 500 users convert and the acceptance ratio is 50%, only 250 conversions will be attributed.
Are campaigns outside of the canvas included in this report?
No. The Paths to Conversion report only includes campaigns, tactics, and ad types that are part of the Canvas where the report is generated. Campaigns outside of that Canvas are not included in the pathway analysis.
Are all campaign types included in the Paths to Conversion report?
No. The Paths to Conversion report only includes campaigns, tactics, and ad types that are part of an Open Web campaign on the Canvas and meet eligibility requirements. Users cannot generate a report for Digital Out‑of‑Home, Email, or Meta. These campaign types fall outside the scope of the report and do not appear in the pathway analysis.